Financial Capital
Prudent approach to financial capital management

Our financial capital management underpins our disciplined approach to long-term value creation. We ensure prudent capital allocation, supported by a strong balance sheet, sustainable cash flows, operational excellence and a healthy capital structure. Our sustained performance continues to earn top-tier credit ratings, reflecting the inherent strength of our standalone businesses and a well-managed financial risk profile.
Strategies Impacted
SDGs Impacted

Material Topics Impacted
Business Overview
Key Highlights, FY 2025-26
| FY 2025-26 | FY 2024-25 | FY 2023-24 | |
|---|---|---|---|
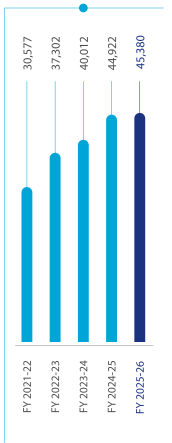
| Economic Value Generated | 46,312 | 45,794 | 40,699 |
| Economic Value Distributed | 41,599 | 41,161 | 36,764 |
| Economic Value Retained | 4,712 | 4,633 | 3,935 |
Driving Performance. Delivering Sustainable Returns.
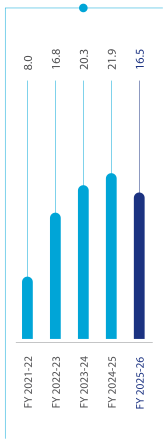
Over the past decade, we have undertaken a strategic shift in business mix, reducing exposure to EPC projects and enhancing focus on services and value-added products. This transition, alongside selective participation in high-margin contracts across water, power and irrigation, has strengthened cash flows, improved working capital efficiency and enhanced overall financial stability.
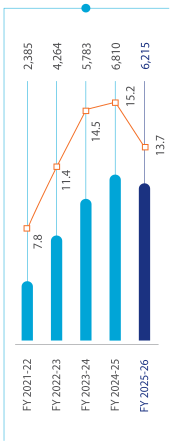
We ensure consistent improvement in profitability, driven by a more balanced business mix from our international operations calibrated pricing strategies and a growing share of high-margin, reliable services businesses.
Return-Based Approach
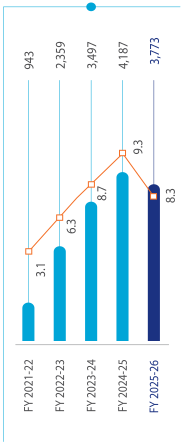
Our prudent financial management ensures consistent profitability and returns. A robust balance sheet, competitive cost structure and diversified portfolio of cost-efficient products position us to capitalise on growth opportunities while maintaining financial flexibility. A return-based framework guides capital allocation decisions, aimed at improving margins, enhancing Return on Capital Employed (ROCE) and ensuring optimal deployment of resources across standalone and subsidiary businesses.
Cash Flow Management
We follow a judicious cash flow management approach, funding capital expenditure largely through internal accruals while maintaining adequate liquidity to meet present and future financial obligations. This helps us maintain operational resilience and long-term financial stability.
Optimal Capital Structure
We undertake focused efforts to minimise debt costs, enabling us to achieve a zero-debt position and providing greater agility to pursue growth opportunities. Our conservative approach allows us to rely on internal accruals to fund our operations and expansion plans, ensuring a strong and sustainable capital structure.
Cost Optimisation and Efficiency Improvement
Cost leadership remains a key driver of value creation. Through cost optimisation, backward integration, supply chain efficiencies and automation, we have strengthened operational efficiency while maintaining industry-leading quality standards. Continuous adoption of modern and advanced technologies supports productivity gains and cost competitiveness.
We have also implemented value engineering to reduce product weight and improve power efficiency. Further, we have introduced online monitoring of pump performance alongside advanced manufacturing technologies such as 3D printing, artificial intelligence, virtual reality and the Internet of Things, to bolster our market position.
Diversifying Revenue Base
We continue to diversify our revenue base, with growing traction in overseas services, IoT-enabled platforms and subscription-based offerings, enhancing margins and earnings.
Outlook
We expect growth in EBITDA and profitability, driven by a stronger order book, higher share of engineered and made-to-order products, easing commodity pressures and sustained contribution from services.