Natural Capital

पर्यावरणं रक्षेतु,
सर्वे जीवनाः समृद्धिम्
By protecting the environment, all life will thrive.
Our Sustainability
Mission
Support business through harbingering ESG initiatives beyond compliance and be a role model to protect mother earth
Our Sustainability
Vision
Be a business differentiator, strengthening the brand KBL through pioneering sustainability and excellence practices
STRATEGIES IMPACTED
SDGs IMPACTED

MATERIAL TOPICS IMPACTED
- M2 Environmental Management and Biodiversity
- M4 Water Stewardship and Water Management
- M5 Regulatory Compliance and Business Ethics
- M9 Sustainability Disclosure and Reporting
- M11 Waste Management and Circular Economy
- M12 Energy Management and Efficiency
- M14 Innovation and Sustainable Product Development
- M15 Sustainability Strategy and Climate Transition
- M17 Climate Change and GHG Emissions
KEY HIGHLIGHTS, FY 2025-26
38%
Renewable energy mix
31%
Recycled water
70%*
Reduction in Scope 1 emission intensity over 2022-23
* Standalone
Pioneers


FY 2008-09
IGBC LEED platinum Green Building in Pune – Corporate office
FY 2021-22
Pump company to implement Integrated Management System

FY 2023-24
Only pump company to receive CII GreenCo rating twice

FY 2023-24
Only pump company to achieve CII GreenPro certification
FY 2024-25
Only pump company to implement “Zero Waste To Landfill” initiative

FY 2024-25
Indian pump company to take NET ZERO targets
PILLARS OF KBL’S ENVIRONMENTAL SUSTAINABILITY STRATEGY


10% reduction in Specific Energy Consumption by 2030 (as a baseline of 2023-24)
Enhancement of Renewable Energy up to 70% by FY 2029-30
ENERGY TRANSITION: ENHANCING OUR RENEWABLE ENERGY USAGE
4.75 MW
Rooftop Solar
13.5 MW
Open Access Solar
4 MW
Wind Energy
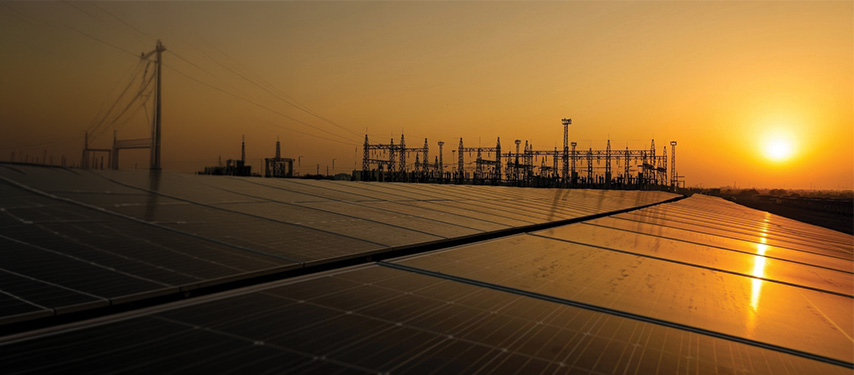
Renewable Energy Consumption: Consolidated (in %)
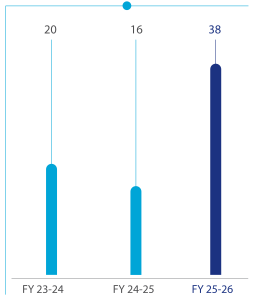
KBL is advancing its energy transition journey by progressively shifting towards cleaner, low-carbon and more sustainable energy sources across its operations. Our approach to energy transition is centred on reducing dependence on conventional fossil-based energy and increasing the share of renewable and energy-efficient solutions. A key pillar of this transition is the adoption of renewable energy.
KBL has implemented 13.5 MW of open access solar power, complemented by rooftop solar of 4.75 MW and an 4 MW Wind Power across facilities. This integrated approach to renewable energy sourcing has enabled KBL to increase its overall renewable energy share to 38% of its total energy consumption.
As a result of this transition, KBL has achieved a substantial reduction in greenhouse gas (GHG) emissions, contributing to our broader environmental and climate action goals. The use of clean energy not only minimises dependence on conventional fossil fuels but also enhances energy efficiency and long-term sustainability.
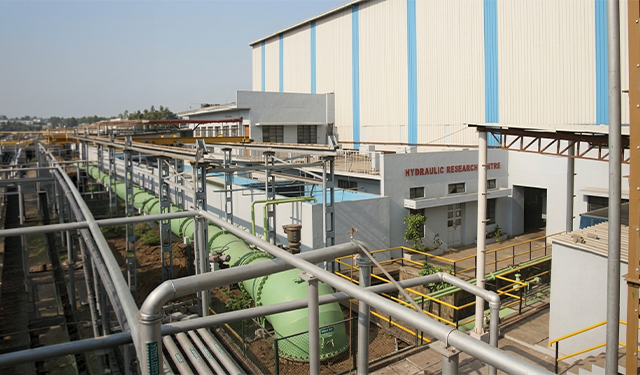
Recovering and Reusing Energy at Hydraulic Research Centre
Recovering and reusing energy at the Hydraulic Research Centre involves optimising the energy used in pump and flow testing systems through efficient design and technology. Most facilities adopt closed-loop water circulation, where water is continuously recirculated, minimising the need for fresh pumping. High-pressure discharge from pump testing is utilised to drive turbines or Pump-As-Turbine (PAT) systems, converting excess hydraulic energy into useful mechanical or electrical energy. Additionally, Variable Frequency Drives (VFDs) help regulate pump speed based on demand, reducing unnecessary power consumption. Where elevation differences exist, gravity-based systems can further recover energy using micro-turbines. Heat generated from pumps and motors can also be captured and reused through heat exchangers. Together with smart monitoring and automation systems, these measures significantly enhance energy efficiency, reduce operational costs and support sustainable operations within the research facility.
Customer Impact at a Glance
Together with our customers, 9,500 MW of green energy has been generated, using PAT and PICO pumps, avoiding 6.83 million tonnes of GHG emissions to date.
Driving Energy Efficiency Through Product Innovation
Energy Intensity
0.145 GJ/Product
Apart from KBL pumps, KBL turbines are engineered with a strong focus on energy efficiency, precision manufacturing and advanced hydraulic design, ensuring optimal performance and reduced lifecycle costs.
We continue to innovate in energy recovery through our PICO and PAT patented pump models, designed to meet low-to-moderate energy requirements across diverse industries. These pumps can operate in reverse mode as turbines to generate electricity. While PICO is generally used for meeting energy requirements of up to 5 kW, PAT is used for meeting comparatively higher energy requirements of up to 100 kW. When deployed as complete energy-generation systems, these solutions help customers reduce energy costs while offering an effective alternative for lowering carbon emissions, bringing clean, decentralised energy to remote communities.
Minimum Efficiency Index Certified Pumps
We offer a range of MEI (Minimum Efficiency Index) certified pumps (e.g., DBxe, KW SC, KPD End Suction Process Pumps, KDI EE5 Monobloc Pumps) designed to meet international energy efficiency standards for rotodynamic pumps. The MEI is defined under European regulations and ensures that pumps operate above a specified minimum efficiency level, helping industries reduce energy consumption and operating costs.
KBL’s MEI-certified pumps, particularly in end-suction, inline and split-case categories, are engineered with optimised hydraulic designs, precision manufacturing and reduced internal losses. These pumps comply with global benchmarks by improving efficiency across the duty range, not just at the Best Efficiency Point (BEP). As a result, they deliver lower power consumption, reduced lifecycle costs and minimised carbon emissions.
By adopting MEI-compliant designs, KBL supports sustainability initiatives and helps customers meet energy regulations, making these pumps suitable for applications in water supply, irrigation, HVAC and industrial processes.
Redefining HVAC Performance with Vertical Inline Pump KW-SC
The CII GreenPro Certified KW-SC Vertical Inline Pump represents a significant advancement in KBL’s energy-efficient pump portfolio. Engineered for liquid circulation in heating and air-conditioning systems, the pump enhances HVAC performance, improves temperature control and contributes to lower energy consumption and operating costs. Its compact vertical design makes it well-suited for space-constrained mechanical rooms, while its versatility enables applications across air conditioning, industrial circulation, bottling plants and water boosting systems. Key benefits include ease of maintenance, reduced downtime and lower lifecycle costs.
Lowest Lifecycle Cost Pumps
The CII GreenPro Certified Lowest Lifecycle Cost (LLCTM) Pump series, reduces energy consumption and maintenance costs. Given their unique features, these pumps offer substantial energy savings potential without reducing pump efficiency over a longer period, resulting in low lifecycle cost compared to conventional pumps. These pumps are expected to reduce 1,000-1,200 MT CO2eq within the first 10 years of installation.
DBxe End Suction Pump Series
The highly efficient end suction pump series DBxe is designed to save up to 20 MT CO2eq in the first 10 years of installation operations. With thousands of such pumps being installed annually, this is expected to result in meaningful cost savings and lower energy consumption, reducing our carbon footprint.
Solar Pumps
KBL offers efficient, reliable and sustainable water pumping solutions, using solar energy. These solutions reduce reliance on fossil fuels and are ideal for agriculture, residential bungalows, farmhouses, multi-story residential complexes and commercial uses. Kirloskar Solar Pump and Jalverter® technology maximise solar energy utilisation to deliver water at virtually zero electricity and low maintenance cost.
Energy Efficiency across Manufacturing Facilities
Real-time energy insights for continuous performance improvement. All manufacturing facilities of the Company are ISO 50001:2018 (Energy Management System) certified. Through structured Energy Conservation (ENCON) programmes, we identify opportunities to reduce specific energy consumption and eliminate losses across operations.
Our manufacturing processes are equipped with advanced and energy-efficient technologies. We emphasise process optimisation, equipment modernisation and improved operational controls to ensure efficient energy utilisation across manufacturing processes. Digital tools and automation support in enhancing precision and reducing energy losses.
In addition, we actively promote responsible energy usage among employees. Through awareness programmes and engagement initiatives, we foster a culture where energy conservation becomes an integral part of day-to-day activities.
| Energy in GJ | KBL | KPML | KCPL | KEPL |
|---|---|---|---|---|
| From Renewable Sources | ||||
| Total electricity consumption | 58,981.82 | 12,555.06 | - | 1,510.19 |
| Total fuel consumption | - | - | - | - |
| Total energy consumption from renewable sources | 58,981.82 | 12,555.06 | - | 1,510.19 |
| From non-renewable sources | ||||
| Total electricity consumption | 1,07,686.10 | 6,008.21 | 910.22 | 3,745.34 |
| Total fuel consumption | 19,614.95 | 13,759.07 | 148.79 | 960.51 |
| Total energy consumption from non-renewable sources | 1,27,301.06 | 19,767.28 | 1,059.02 | 4,705.85 |
| Total energy consumed | 1,86,282.88 | 32,322.35 | 1,059.02 | 6,216.04 |
To achieve Water Neutrality by 2030
key highlights FY 2025-26
Zero
Wastewater discharged
8.69 kL/mn
Per Rupee of Turnover Water Intensity*
* Standalone
Water withdrawal and consumption
We adopt a responsible and structured approach to managing water withdrawal and consumption, recognising water as a critical shared resource. KBL sources water primarily from municipal supply, groundwater and third-party water while continuously working to reduce dependence on freshwater sources.
We have implemented multiple efficiency measures to optimise usage across operations. Process improvements, closed-loop systems and infrastructure enhancements help reduce water intensity. The Company also undertakes regular monitoring of water consumption to identify opportunities for conservation and drive continuous improvement.
Water recycling and reuse
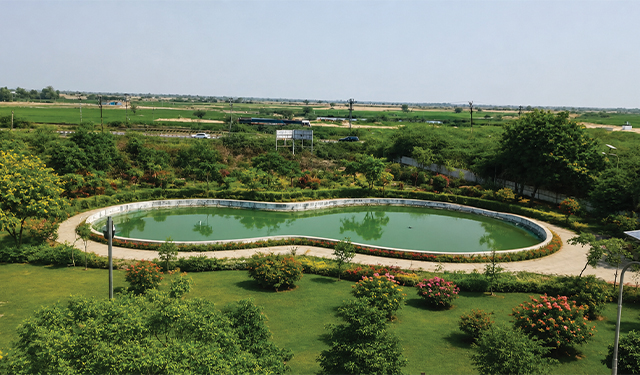
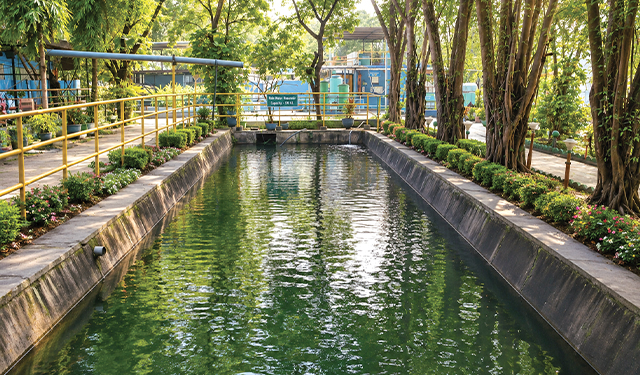
KBL adopts a circular approach to water management by prioritising water recycling and reuse across its operations. Wastewater generated is treated through effluent and sewage treatment plants and reused for industrial processes, utilities and landscaping.
Through continuous monitoring, infrastructure upgrades and integration of rainwater harvesting, we reduce dependence on freshwater and enhance overall water efficiency, supporting our long-term goal of sustainable water management and water neutrality.
| Water in kL | KBL | KPML | KCPL | KEPL |
|---|---|---|---|---|
| Surface water | 2,07,468.13 | 14,198.00 | 1,417.01 | - |
| Ground water | 6,681.78 | - | - | 12,205.59 |
| Third-party water | 31,777.77 | 33,964.13 | - | - |
| Total volume of water withdrawal (in kilolitres) | 2,45,927.68 | 48,162.13 | 1,417.01 | 12,205.59 |
| Use of recycled water | 1,10,359.37 | 11,520.54 | - | 4,538.06 |
To achieve Net Zero in line with India’s target to become Net Zero by 2070
key highlights FY 2025-26
0.0177 MT CO2e/Pump
Scope 1 & 2 Emission Intensity*
48.87%
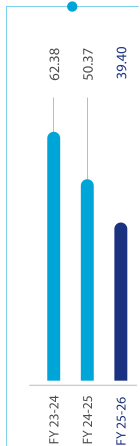
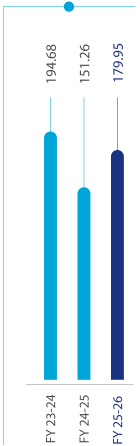
reduction in absolute Scope 1 emissions over FY 2024-25*
25.41%
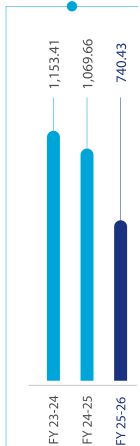
reduction in Scope 2 emissions over FY 2024-25*
*Standalone
Accelerating the Net Zero Journey
We are advancing our Net Zero journey through a structured decarbonisation pathway that integrates climate action into core business operations and strategy. We have set short, medium and long-term targets for GHG mitigation, focusing on reducing Scope 1, Scope 2 and value chain (Scope 3) emissions.
Our decarbonisation strategy is anchored in energy transition, operational efficiency and low-carbon innovation. We are actively enhancing energy performance through deployment of energy-efficient technologies, process optimisation and digital energy management systems. A significant thrust is placed on increasing renewable energy penetration to decarbonise electricity consumption and reduce Scope 2 emissions.
For Scope 1 emissions, we are progressing towards fuel switching, electrification of processes involving adoption of cleaner and low-emission fuels to reduce direct combustion-related emissions. For Scope 2 emissions, we are enhancing our renewable energy capacity at plants. Simultaneously, we are strengthening Scope 3 emissions management by improving GHG inventory, enhancing value chain engagement and integrating sustainable procurement and logistics optimisation practices.
We leverage product decarbonisation as a key enabler, developing high-efficiency pumping solutions that reduce lifecycle emissions and support customers in achieving their own climate targets. We are further exploring circular economy principles, resource optimisation and emerging low-carbon technologies to accelerate the Net Zero transition.
Through robust emissions accounting, continuous monitoring and alignment with global climate frameworks, we are systematically progressing on our decarbonisation roadmap, reinforcing our commitment to achieving Net Zero emissions and contributing to a climate-resilient future.
GHG Emissions
SCOPE 1 EMISSIONS IN MT
KBL
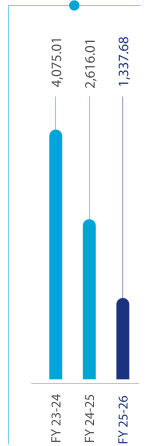
KPML
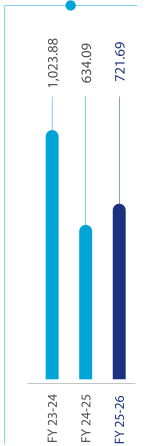
KCPL
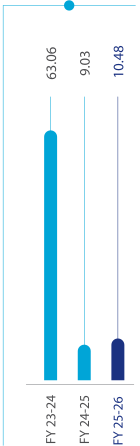
KEPL
SCOPE 2 EMISSIONS IN MT
KBL
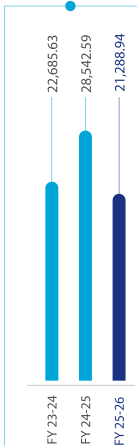
KPML
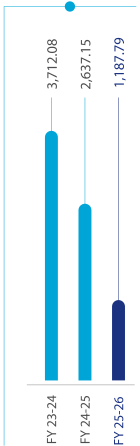
KCPL
KEPL
SCOPE 3 EMISSIONS
(Category-wise %)
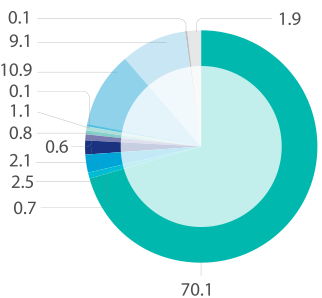
- 1 Purchased goods and services
- 2 Capital goods and services
- 3 Fuel- and energy-related activities
- 4 Upstream transportation and distribution
- 5 Waste generated in operations
- 6 Business travel
- 7 Employee commuting
- 8 Upstream leased assets
- 9 Downstream transportation and distribution
- 12 End-of-Life treatment of sold products
- 13 Downstream leased assets
- 15 Investments
Management of Air Emissions
We have implemented advanced emission control systems, including dust extraction, scrubbers and filtration technologies, to reduce Particulate Matter (PM), Sulphur Oxides (SOx) and Nitrogen Oxides (NOx) generated from manufacturing processes. Preventive maintenance, process optimisation and equipment upgrades are undertaken regularly to enhance combustion efficiency and reduce emission intensity. Air emissions are continuously monitored through defined protocols to ensure compliance with statutory requirements and internal standards.
| Air Emissions in MT | KBL | KPML | KCPL | KEPL |
|---|---|---|---|---|
| Suspended particulate matter (SPM) | 39.562 | 1.420 | 0.134 | 2.705 |
| Sulphur dioxide (SO2) | 0.363 | 0.401 | 0.007 | 0.001 |
| Nitrogen oxide | 0.842 | 0.135 | 0.043 | 0.004 |
| VOC | 4.366 | - | - | - |
| CO | 0.018 | - | - | - |
To enhance the use of recycled material above 50% during in-house processes and achieve “Zero Waste to Landfill” status for the manufacturing plants by 2030.
Embedding Circularity in Product Design
We integrate circular economy principles at the design stage to minimise environmental impact across the product lifecycle. We focus on designing products that are durable, resource-efficient and easy to maintain, repair and refurbish, thereby extending their useful life and reducing material consumption.
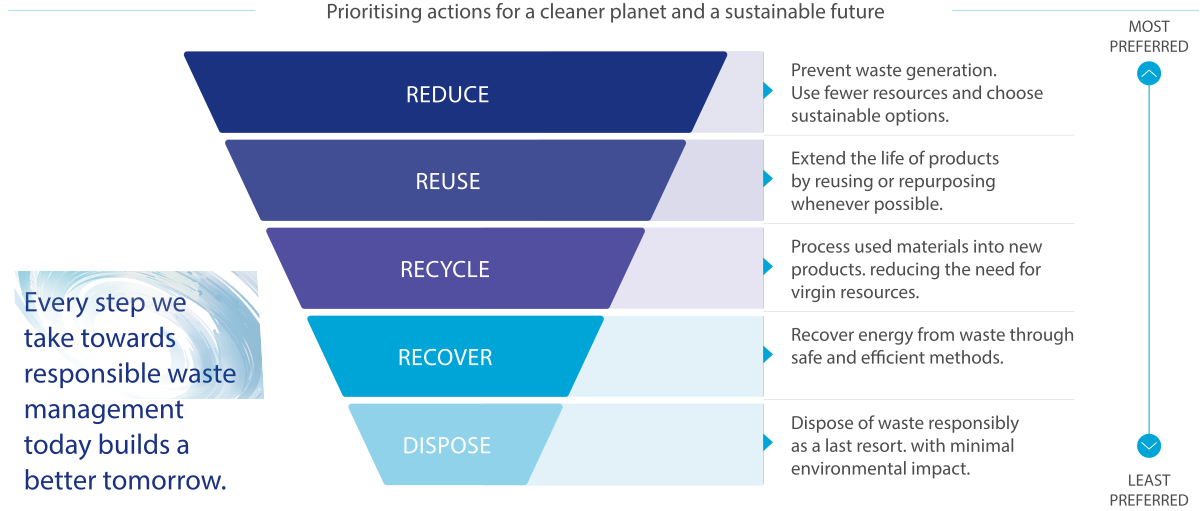
Our Waste Management Hierarchy
Waste Management at Operations
We focus on reducing material intensity through process optimisation, lean manufacturing and efficient inventory management, thereby minimising scrap and waste generation at source. Waste streams generated are systematically segregated into hazardous and non-hazardous categories and managed in accordance with regulatory requirements and best practices.
A significant proportion of non-hazardous waste, including metal scrap, packaging materials and other recyclables, are channelled back into the production cycle or sent to authorised recyclers for material recovery. Hazardous waste is handled through authorised agencies, ensuring safe treatment, disposal or co-processing in line with environmental norms.
End-of-Life Treatment of Products
We adopt the 3R principle – Reduce, Reuse, and Recycle – across the design and manufacturing stages to optimise resource efficiency and minimise environmental impact. Our products are designed to facilitate reuse and recycling of components at the end of their lifecycle. With metallic components accounting for up to 95% of product composition, a significant portion can be recovered and reprocessed into raw materials for new production. Given that metals can be recycled multiple times without compromising quality, our end-of-life product treatment approach reinforces our commitment to sustainable practices.
Our Product end-of-life management guidelines are available on KBL Website
https://www.kirloskarpumps.com/spares-and-services/end-of-life-management-procedure/
| Waste in MT | KBL | KPML | KCPL | KEPL |
|---|---|---|---|---|
| Plastic waste | 14.26 | 1.76 | 3.42 | 0 |
| E-waste | 3.58 | 0 | 0.035 | 0 |
| Bio-medical waste | 0.0057 | 0 | 0 | 0 |
| Construction and demolition waste | 0 | 0 | 0 | 0 |
| Battery waste | 3.33 | 0 | 0 | 0 |
| Radioactive waste | 0 | 0 | 0 | 0 |
| Other hazardous waste | 175.31 | 18.24 | 61.39 | 48.61 |
| Other non-hazardous waste | 36,224.52 | 3,922.16 | 3.62 | 219.98 |
| Total waste generated | 36,421.03 | 3,942.16 | 68.47 | 268.59 |
| Total waste recovered through recycling | 5,540.50 | 674.40 | 68.47 | 267.54 |
| Total waste recovered through reusing | 8,200.73 | 0 | 0 | 0 |
| Total waste recovered through other recovery options | 39.23 | 0 | 0 | 0.22 |
| Total waste incinerated | 0.73 | 0 | 0 | 0 |
| Total waste landfilled | 22,628.11 | 3,267.75 | 0 | 0 |
| Total waste disposed through other disposal operations | 11.71 | 0 | 0 | 0.83 |
To ensure ‘‘No Net Loss’’ of Biodiversity across our operations
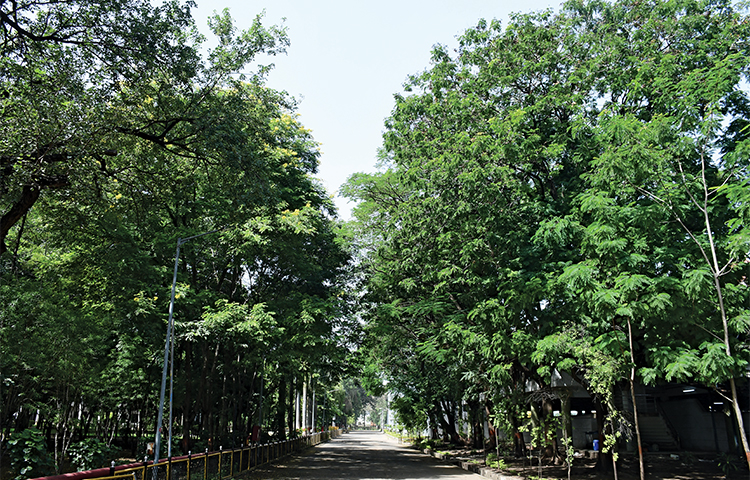
We integrate green practices across our facilities, including tree plantation drives, periodic biodiversity assessment, greenbelt development and the preservation of native species.
We have developed greenbelts across our manufacturing facilities by planting native and drought-resistant species, which help improve air quality, prevent soil erosion and create habitats for local flora and fauna.